Reading an Artificial Mind: Visualizing the Neural Net
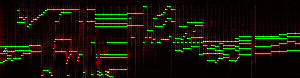
In my previous post, I described my music-composing neural network. In some of the time since then, I extracted some interesting images to visualize the neural network's internal state. And this is what I got:
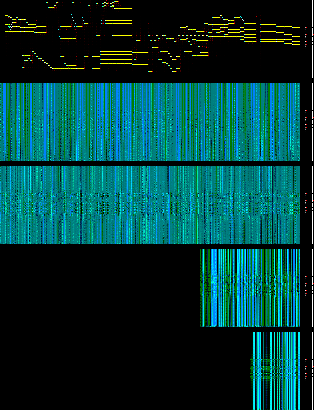
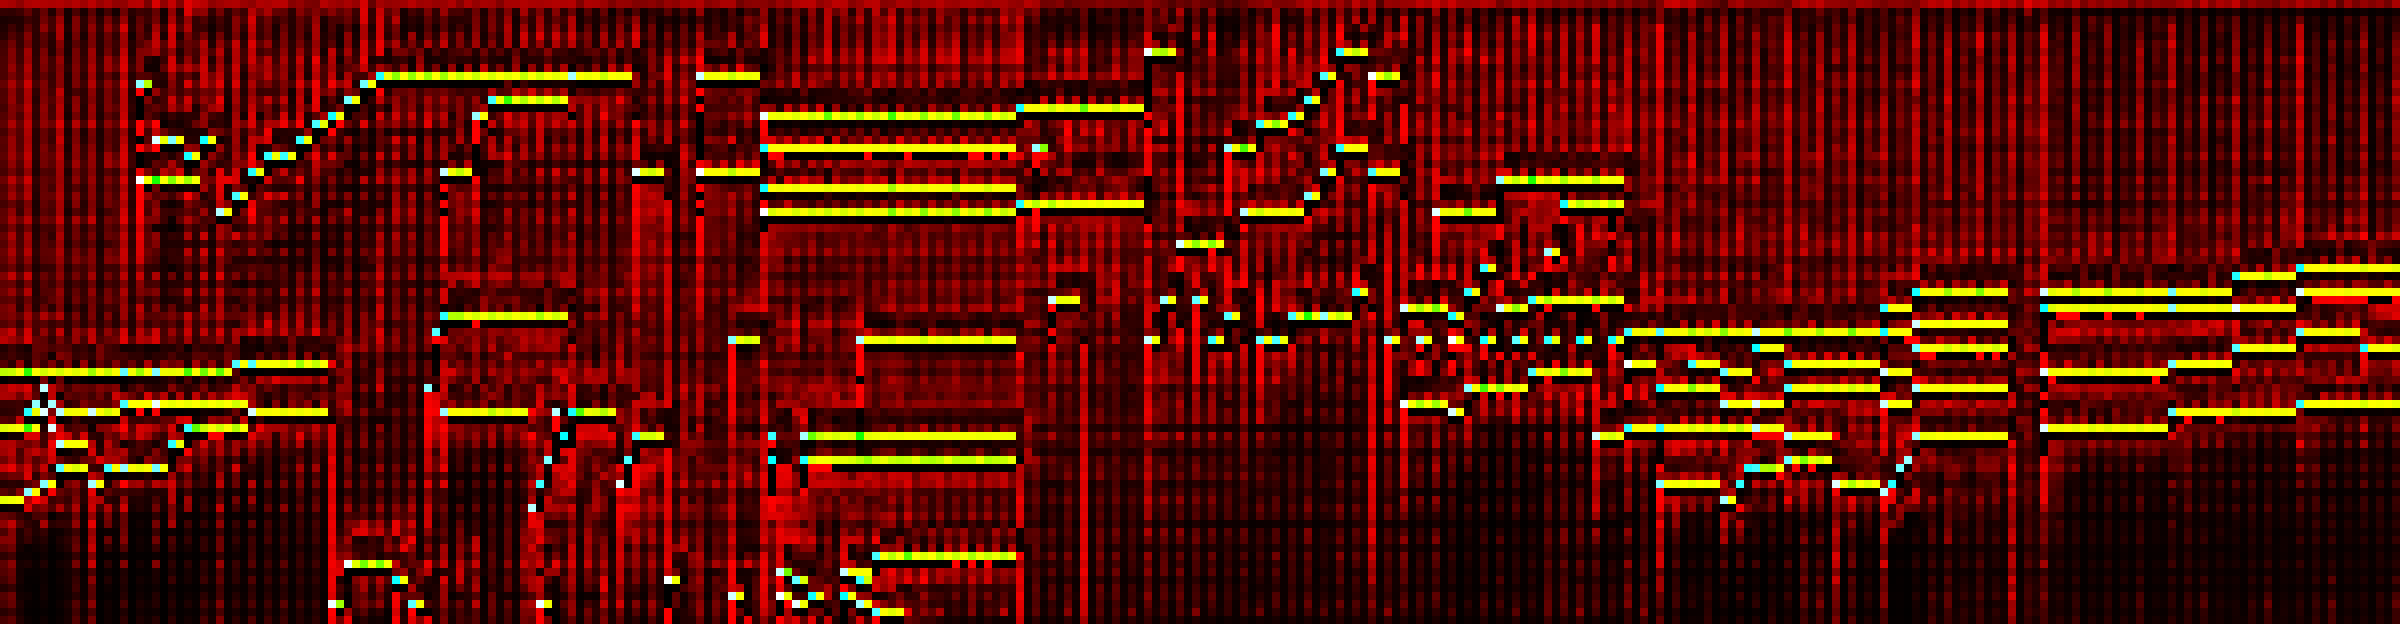
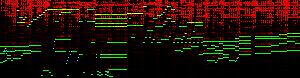
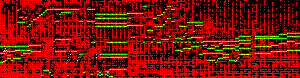
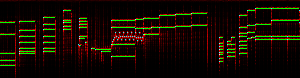
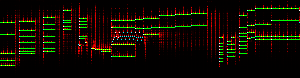
Basically, this image was generated by taking the activation and memory cell state of each neuron in the network, and plotting it as a single pixel. The y-axis for each section represents the note that the neuron is connected to, and the x-axis is arbitrary (each column is a different neuron in that layer). The top row is the actual notes generated, the next two rows are the states of the first and second LSTM layers (which are recurrent along the time axis), and the last two rows are the states of the third and fourth LSTM layers (which are recurrent upwards, along the note axis). Finally, on the right, there are two sets of grayscale and red dot columns. The gray part of the leftmost pair represents the probability that the given note is played, and the red dot is whether or not we actually chose to play it, based on that probability. Similarly, the gray part of the rightmost pair is the probability of rearticulating a note, and the red dot is whether or not we chose to do so.
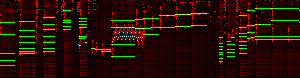
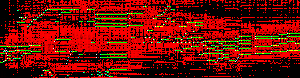
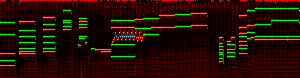
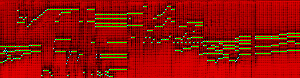
Here's a similar image at a different point in composition:
Notice how the network seems to behave differently in the vicinity of the notes it has played or chooses to play next! Even with the large amount of information, the locality of the neural network is still visible.
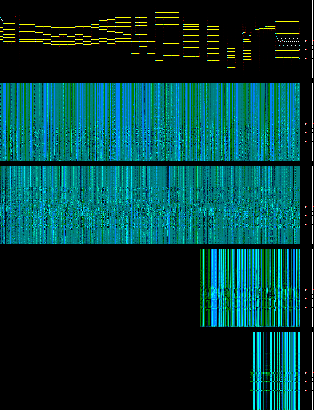
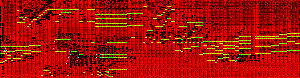
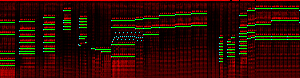
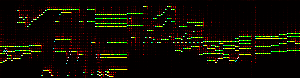
We can also visualize in a different way. Instead of taking snapshots in time, and looking at all neurons, we can pick a single neuron and track its activation over time and notes. This is what I have done here, for some arbitrary neurons in the first layer:
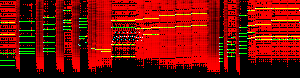
Here are some from the second layer:
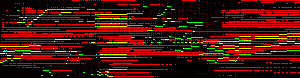
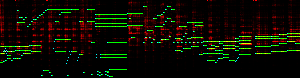
Third layer:
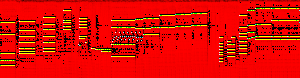
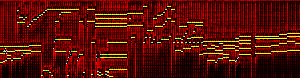
And fourth layer:
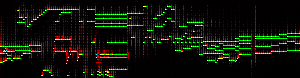
It's pretty hard to actually figure out what the network is doing here, but you can definitely see some things: - There seem to be relatively consistent periodic activations on different parts of the beat for a lot of neurons. - Some neurons seem to respond very differently to the beginnings of notes than to continuations. - Other neurons seem to respond only at particular intervals around notes.
Of course, these represent a very small set of neurons, shown on a relatively small portion of output. Its likely that many other neurons have interesting patterns, and that some of the confusing patterns in these images would make more sense when the network is generating different styles of music. Either way, though, they still look really cool!